

Beginners Guide: 10 Steps to Getting Started with Microsoft Power BI
Our team has spoken with thousands of Microsoft Power BI users and built hundreds of Power BI data analytics solutions. We’ve condensed this experience into a simple step-by-step guide to help new users get started with Power BI.
Below are 10 Steps to Getting Started with Microsoft Power BI containing links to various training resources, articles, and videos.
What is Power BI (YouTube video)
Step 1: What is Microsoft Power BI & Why Should I Use It?
Gartner Magic Quadrant & Forrester Wave (link) both recognize Microsoft Power BI as the leading business intelligence/data analytics platform in the industry.
Think Microsoft Excel on steroids with some lipstick. Watch the 90-second video above for a brief introduction. What are some practical use cases to leverage Power BI?
Migrate a clumsy Excel report to Power BI and gain access to interactive real-time insights to be shared across your company.
Consolidate old legacy reporting from SSRS, Crystal Reports, IBM Cognos, OBIEE, Business Objects, Qlik, MicroStrategy into a single Power BI report built on top of a centralized semantic model.
Automate manual and burdensome reporting efforts across your organization
Start to build a data fabric for AI innovation and exploration
Step 2: Download Power BI Desktop (for Free)
There is no better time to get started than right now. Power BI is easy to use, which has lead to widespread adoption across organizations. Use this link to download Power BI Desktop for Free to your PC. I’m sorry, Mac users, this gets a bit more complicated.
9 things to know before getting into Power BI (YouTube video)
Step 3: Connect to Data & Explore
By this point, you’ve researched all the use-cases for Power BI, downloaded Power BI Desktop for free, and watched some Power BI YouTube thought leaders.
Now find a dataset and click [Get Data]. We recommend starting with data you find interesting like Fantasy Football, personal finances, or building your loved one a Power BI Valentine dashboard (link to article, based on a true story).
Step 4: Follow Power BI Thought Leaders on YouTube
The Microsoft Power BI community is rich with talented trainers and generous thought leaders. We recommend following these Top 10 Power BI YouTube Training Tutorials (link) as you get started learning Power BI.
Step 5: Attend an In-Person Power BI Dashboard-In-A-Day training
You’ve been building your Power BI chops, now you’re probably ready for an in-person classroom style training. Register for a Power BI Dashboard-In-A-Day session or contact us about hosting a 1-day session for your company.
This course is led by Microsoft certified instructors/consultants and based off Microsoft reference material and is updated quarterly to accommodate for the monthly feature releases of Power BI.
Request Information: on how to schedule a Power BI DIAD training session for your team
Step 6: Go Deeper Hands-On Training with Power BI Resources/Labs
It’s time to get your hands dirty with some real-world data.
Now you are getting ready for some formal hands-on training. If you’re willing to spend a little money, we highly recommend the course: ‘Microsoft Power BI Desktop for Business Intelligence’ (link). It’s a fully on-demand hands on learning that provide the data files and labs.
Maven Analytics also hosts monthly Power BI skill challenges for you to continue to hone your skills over time.
Step 7: Publish and Share Reports to Power BI Pro service ($10/month)
Let’s be clear - up until this point Power BI should be 100% free. All of your report development should be done in Power BI Desktop the free version.
Once you decide to ‘share’ a report with your organization you will ‘publish’ the report to Power BI Pro the on-line service ($10/month per user). Here you will learn about creating workspaces and apps and how to securely share reports throughout your organization.
Don’t be confused by Power BI Premium or PBI Premium per/user which are reserved for high volumes of data and/or enterprise size deployments of Power BI. Below is a simple breakdown to help keep things straight.
Power BI Desktop: used for all Power BI report development for Free
Power BI Pro: on-line service to publish and share reports for $14/user
Power BI Premium: robust business analytics service designed to meet the needs of large enterprise/large data volumes for $14/user (or contact your Microsoft Rep)
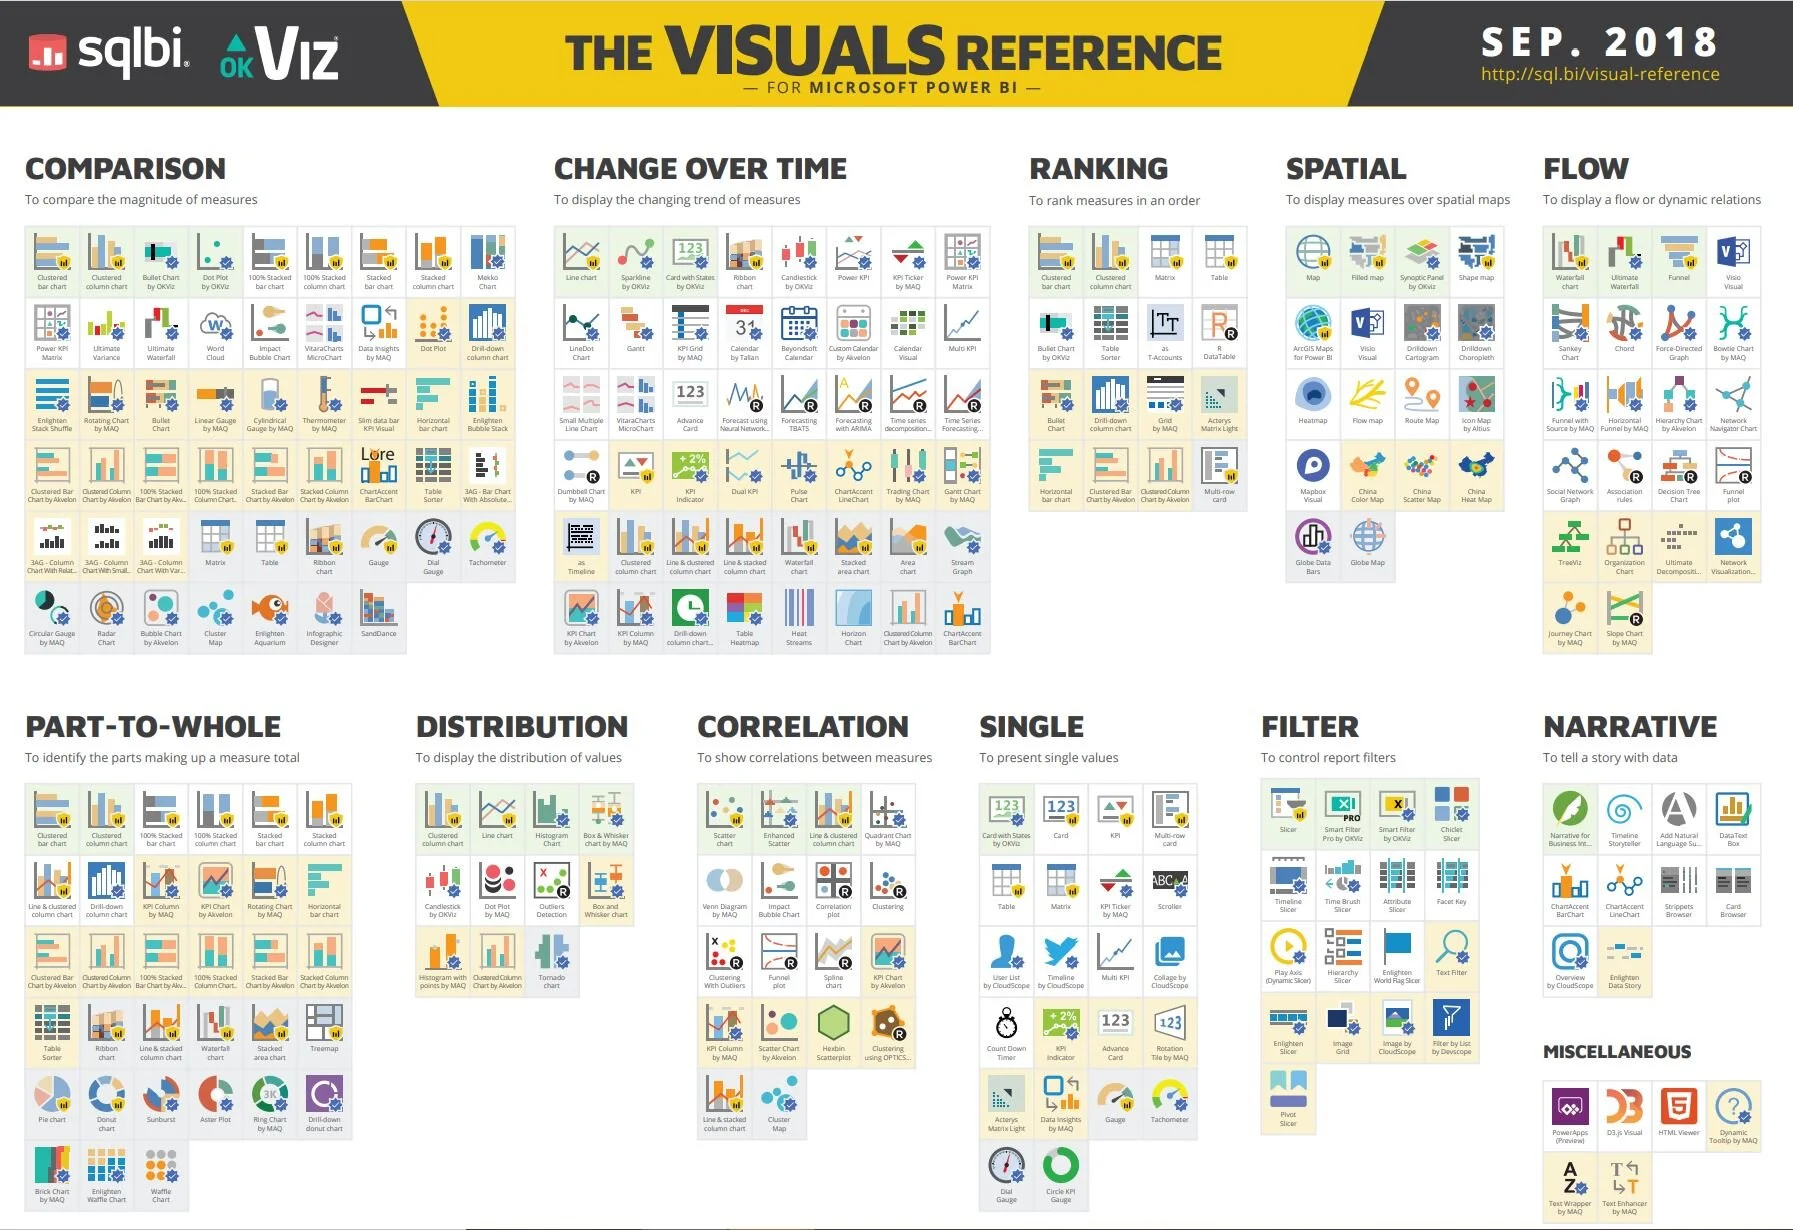
Download The Visuals Reference Guide (PDF) from sqlbi.com
Step 8: Invest in learning DAX & Tabular Semantic Modeling
This is the huge leap to go from good to great. Anyone can build a great Power BI report, but to build a true Power BI solution it requires deep knowledge of tabular data modeling and how DAX measure and calculations are best used.
For even for the craftiest Power BI consultants this process can takes months or even years. Have patience and enjoy the process. Avoid these common Power BI Pitfalls along the way.

Explore Power BI Support (Managed Service)
Step 9: “Phone a Friend” or Find an Ongoing Power BI “Support” System
Don’t go at it alone. Make sure you have a support system in place. A 15-minute phone call could save you 15 hours of reading through blogs/watching videos.
Find a phone a friend or leverage an ongoing Monthly Support option (link) from DA-100 Certified Power BI consultants.
Step 10: Join a local Power BI Community or Meetup
Last but not least, find a local Power BI community, user-group, or Meetup that supports your ongoing growth.
There are many great options on-line and in-person like the Twin Cities Power BI Meetup Twin (link) that meets each month over a craft beer.

Twin Cities Power BI Meetup on the Surly Brewing patio in 2021.
Additional Resources: More Power BI resources to guide you to data success:
Microsoft: Power Platform Learning Paths
Website: Power BI Resources & Training Material | Enterprise DNA
YouTube: How to Power BI - YouTube
YouTube: Curbal - YouTube
Webinar: Power BI Data Literacy and Analytics Enablement (April 20th)
For additional resources or schedule a whiteboard strategy session with our team of our certified Power BI experts contact: powerbi@fultonanalytics.com

Robert Gerads is CEO of Fulton Analytics, a data analytics strategy and consulting firm based in St. Paul, MN.
He is also the founder of the Twin Cities Power BI Meetup.